The RE.DOCTOR Vital Signs Handbook: A Guide to Health Metrics
1. Introduction to Vital Signs and Remote Monitoring
In clinical health sciences, vital signs are the primary measurements of the body’s most essential functions. They provide a foundational assessment of a person’s physiological state, offering critical data on how effectively the heart, lungs, and metabolic systems are operating.
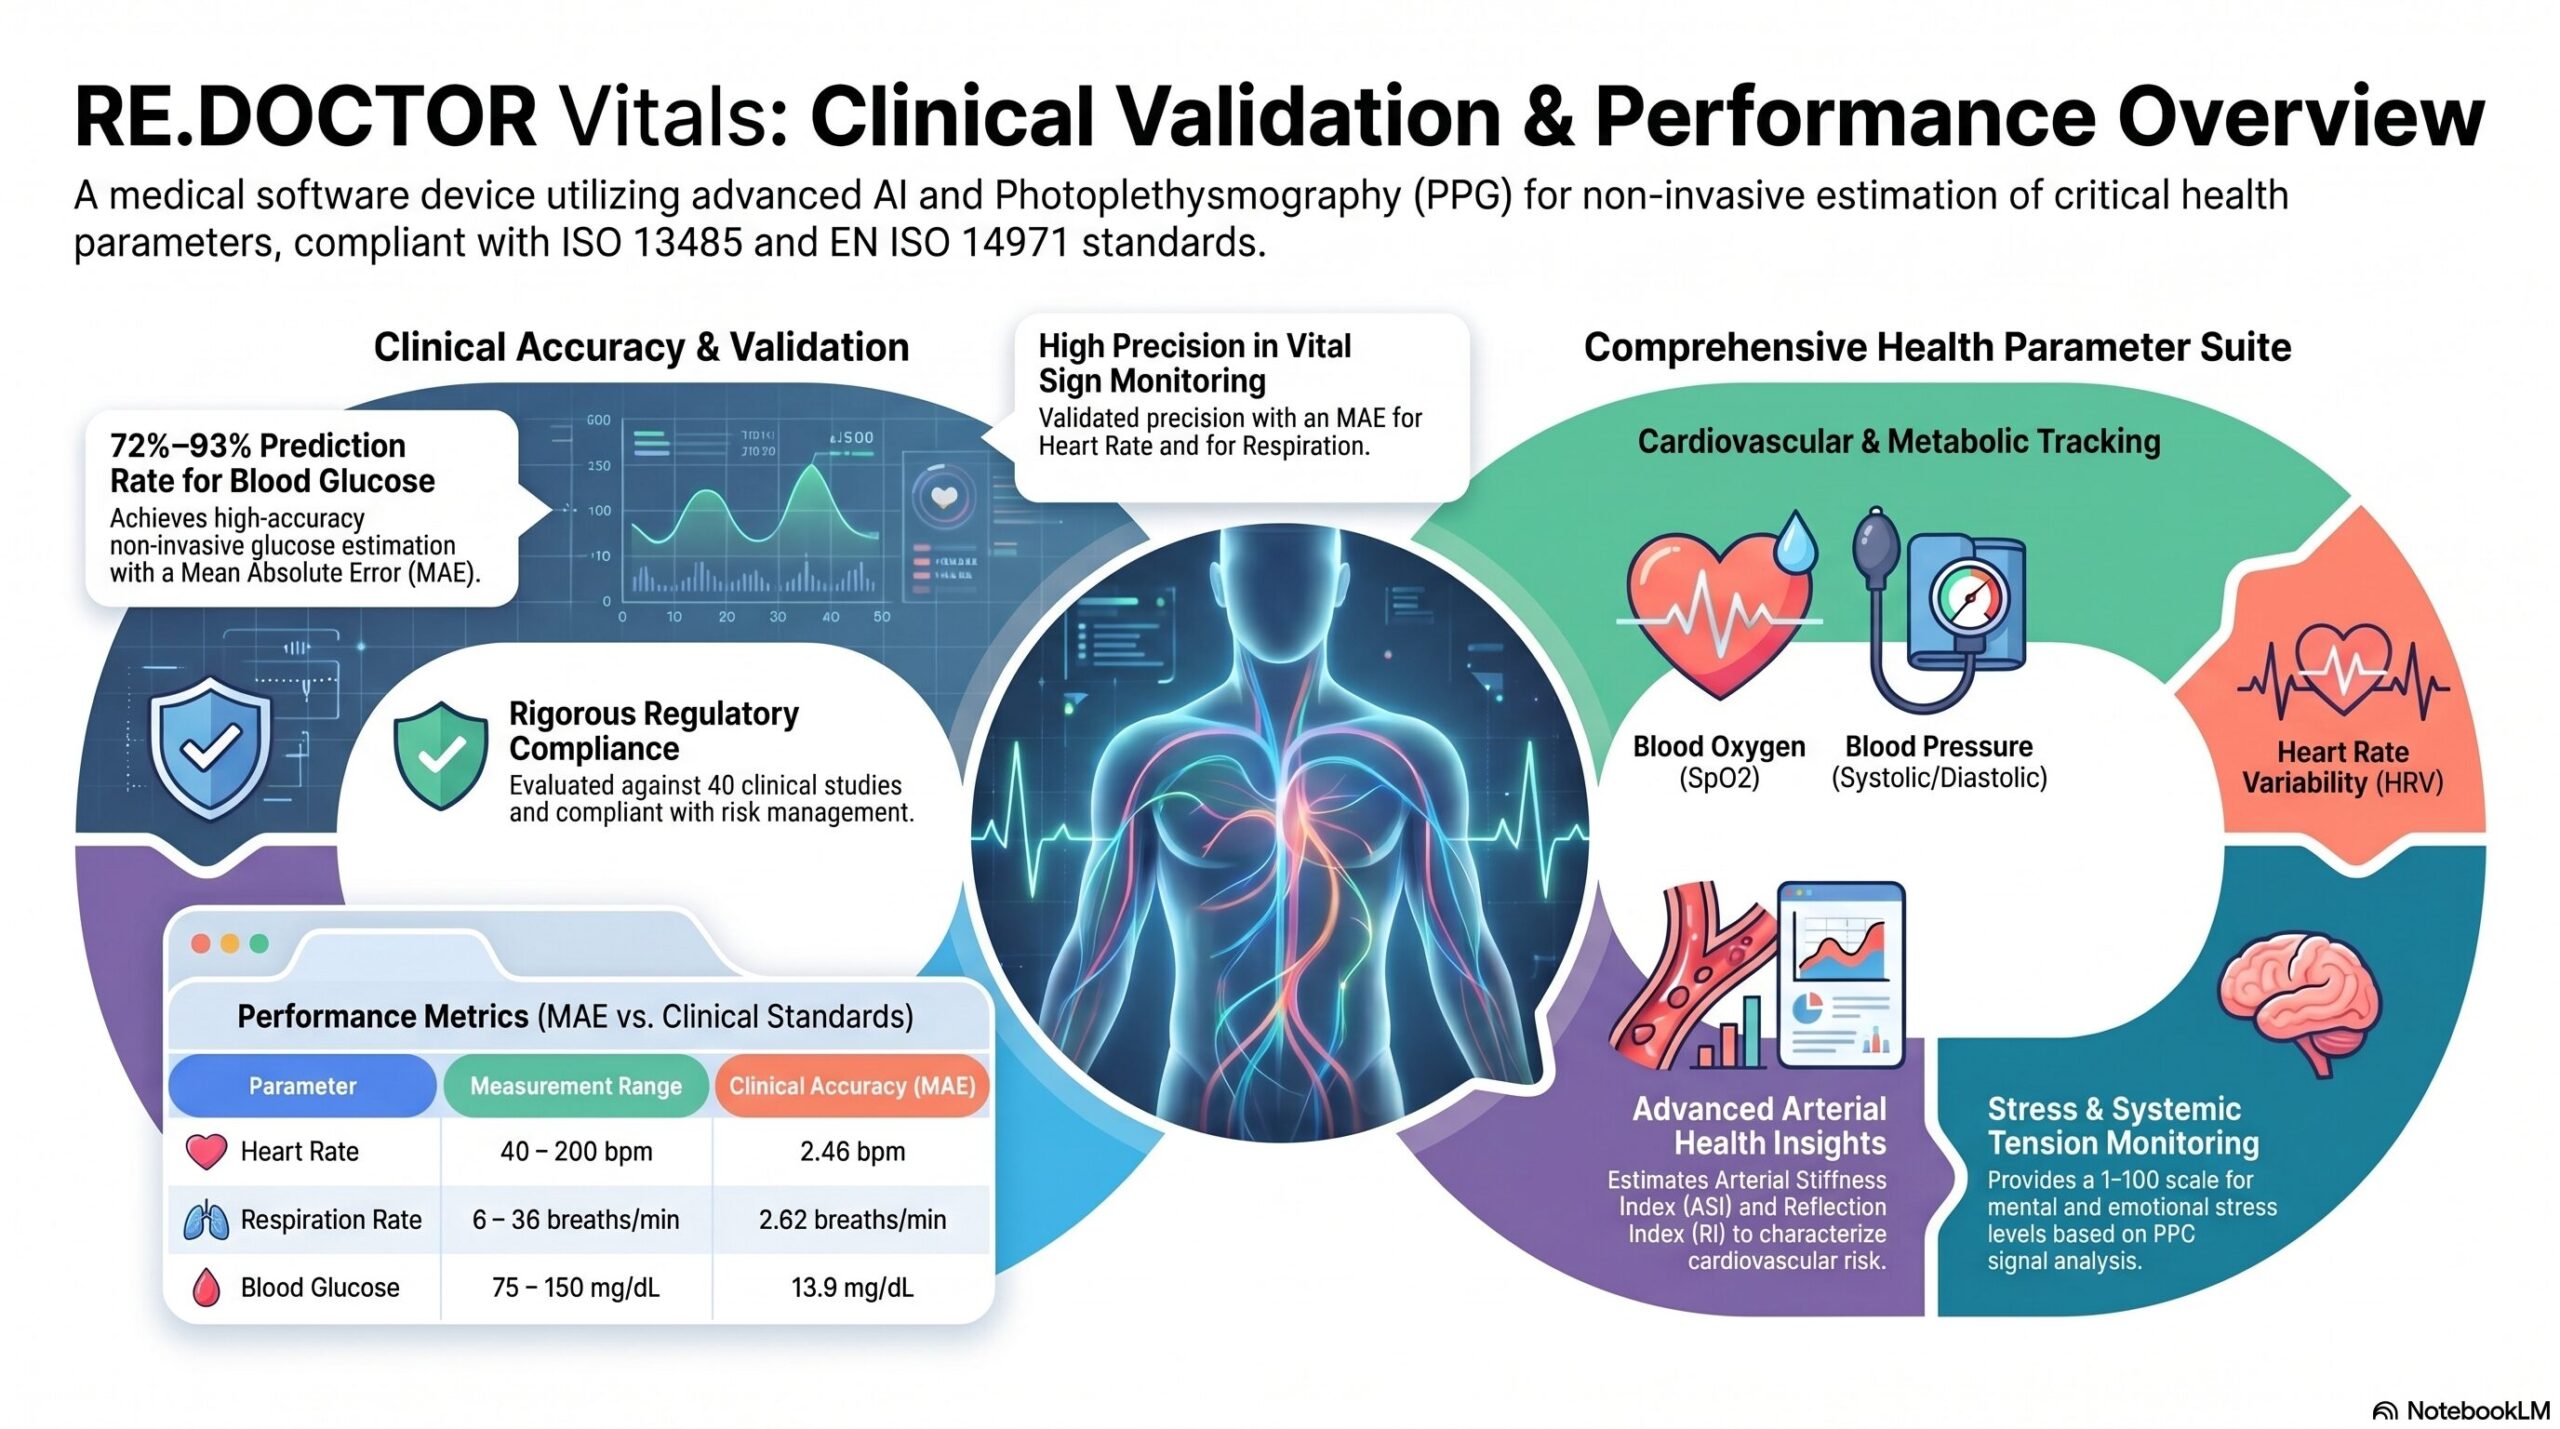
Traditionally, capturing these metrics required invasive blood draws or bulky diagnostic hardware. However, the “state of the art” in health monitoring has shifted toward non-invasive estimation using photoplethysmography (PPG). By using a smartphone camera or specialized sensors to analyze light absorption through the skin, the RE.DOCTOR SDK utilizes advanced AI to estimate complex biomarkers with clinical-grade precision.
The clinical validity of this technology is substantiated by high-performance data: the RE.DOCTOR system maintains a 72–93% Prediction Rate across its parameter suite. Specifically, the technology achieves a remarkably low Mean Absolute Error (MAE)—measuring just 2.46 bpm for Heart Rate, 2.62 brpm for Respiration Rate, Und 13.9 mg/dL for Blood Glucose—proving that software-based monitoring can rival traditional hardware.
The transition to non-invasive, software-based monitoring represents a paradigm shift in patient autonomy. Unlike traditional clinical environments, this technology allows for monitoring during “daily living conditions.” This enables early detection of relapses or metabolic shifts (such as blood glucose spikes) in real-time, moving the healthcare model from reactive clinical visits to proactive, continuous health management.
By mastering these metrics, we can better understand the body’s internal responses, starting with the most fundamental biological process: respiration.
——————————————————————————–
2. Oxygenation and Respiration: The Breath of Life
Oxygenation and respiration are the dual pillars of metabolic function. One measures the “fuel” (oxygen) present in the blood, while the other measures the frequency of the mechanical work (breathing) required to maintain that supply.
- Blood Oxygen (SpO2): A measure of oxygen saturation, representing the percentage of hemoglobin bound to oxygen compared to the total hemoglobin available.
- Respiration Rate (Resp): The number of breaths taken per minute at rest.
Metric Name | Definition | Normal Range (Healthy Adults) | The “Warning Zone” |
Blood Oxygen (SpO2) | Percentage of oxygen-bound hemoglobin. | 95% – 100% | Below 94% – 90% (Clinical Concern)* |
Respiration Rate (Resp) | Number of breaths per minute (brpm). | 12 – 18 brpm | Under 12 or over 25 brpm |
*Note: While the SDK can detect levels down to 80%, clinical warning levels for health typically begin when saturation falls below 94%.
The Biology of Breath: Inside red blood cells, a protein called hemoglobin acts as a transport vehicle. Each molecule of hemoglobin can carry up to four molecules of oxygen. SpO2 measures how “saturated” these vehicles are. This oxygen is then delivered to the heart to be pumped throughout the body.
——————————————————————————–
3. Cardiac Rhythm and Variability: Measuring the Heart’s Work
Monitoring the heart involves analyzing both the frequency of the pulse and the subtle timing differences between each beat.
- Heart Rate (HR): Measured in beats per minute (bpm), this is the frequency at which the heart pumps blood.
- Heart Rate Variability (HRV): Measured in milliseconds (ms), this represents the variation in time intervals between adjacent heartbeats.
Rhythm vs. Frequency: While HR tracks speed, HRV tracks the balance of the Autonomic Nervous System (ANS).
- “Fight-or-Flight” State: When the sympathetic nervous system is dominant due to stress, the variation between beats is lower.
- Relaxed State: When the parasympathetic nervous system is dominant (resting and recovering), the variation is typically higher.
HRV and the Aging Process: HRV naturally declines as the heart and nervous system age. The following data illustrates typical ranges for healthy populations:
Age Group | Typical HRV Range (ms) |
20–25 years old | 55 – 105 ms |
60–65 years old | 25 – 45 ms |
The Autonomic Nervous System simultaneously influences heart rhythm and the tension in your blood vessels, leading directly to the study of hemodynamics.
——————————————————————————–
4. Hemodynamics: Understanding Blood Pressure Dynamics
Blood pressure measures the force of blood against arterial walls. It is defined by two primary figures and the resulting difference between them.
- Systolic Blood Pressure (BPS): The pressure in the arteries when the heart beats.
- Diastolic Blood Pressure (BPD): The pressure in the arteries when the heart muscle rests between beats.
- Pulse Pressure (PP): The numeric difference between the two (PP = Systolic – Diastolic).
Clinical Implications of Pulse Pressure:
- Normal: Approximately 40 mmHg. This indicates a healthy balance in the circulatory system.
- Wide / High: 50 mmHg or higher (and >60 mmHg in older adults). This increases the risk of heart disease, stroke, and rhythm disorders. In diabetic patients, wide pulse pressure is a high-value indicator of potential kidney or eye damage.
- Narrow / Low: One-fourth or less of the systolic pressure. This suggests the heart is not pumping effectively, often seen in heart failure, valve disease, or internal bleeding.
As pressure changes, it reflects the physical state and flexibility of the arteries themselves.
——————————————————————————–
5. Advanced Vascular Health: Stiffness and Reflection
Beyond pressure, we can measure the physical “compliance” and condition of the blood vessels through two specific indices.
- Reflection Index (RI): A measure of the percentage of the pressure wave reflected back from the narrowing of the small arteries.
- Large Arterial Stiffness Index (LASI/SI): An indicator of the speed at which a pulse wave travels, identifying the stiffness of the large arteries.
The “Pebble in a Puddle” Analogy: Imagine throwing a pebble into a puddle. Waves ripple out to the edges and reflect back toward the center, but with less energy. In the body, RI measures the wave reflecting back from the small arteries. High reflection energy (higher RI) correlates to the narrowing or poor condition of the small arteries. Individuals with Left Ventricular Hypertrophy (LVH) often show higher RI values (averaging 80%).
Formulas and Units:
- RI Formula: RI = frac{a}{b} times 100% (where a is the diastolic peak height and b is the total amplitude).
- SI Formula: SI = frac{text{Subject Height}}{Delta T_{DVP}} (where Delta T_{DVP} is the peak-to-peak time of the reflected wave).
- Units: RI is expressed as a % or scale of 0–1; SI is measured in m/s.
Vascular health measurements are a “snapshot” influenced by diet, exercise, and caffeine. To establish a reliable health profile, regular periodic testing is required rather than relying on a single measurement.
——————————————————————————–
6. Metabolic Health: Blood Glucose and Glycemia
Blood glucose (BG) is the concentration of sugar in the blood. Monitoring these levels is vital for the early detection of metabolic disorders.
Category | Fasting Blood Glucose Range (mg/dL) | Clinical Implications |
Hypoglycemia | Below 70 mg/dL | Risk of dizziness/palpitations; needs immediate attention. |
Normal | 70 – 100 mg/dL | Target range for healthy function. |
Prediabetes | 100 – 125 mg/dL | Increased risk for Type 2 Diabetes; lifestyle changes urged. |
Diabetes | 126 mg/dL or higher | Diagnosed if found on two separate tests. |
Hypoglycemia Awareness: If blood sugar drops too low, a student or patient may experience:
- Dizziness and blurred vision
- Excessive sweating
- Heart palpitations
The Autonomic Nervous System acts as a bridge between these biochemical markers and the body’s overall state of tension.
——————————————————————————–
7. Systemic Tension: The Stress Metric
The RE.DOCTOR SDK provides a quantitative metric for systemic tension, referred to as Stress.
“Stress is a physical, mental or emotional factor that causes bodily or mental tension. It is generally recognized as one of the major factors leading to a spectrum of health problems.”
Stress is classified on a 1–100 scale:
- 0–30: Low Stress
- 30–70: Medium Stress
- 70–100: High Stress
The “So What?”: High systemic tension is a clinical concern because it can exacerbate hypertension, cause heart rhythm imbalances, and disrupt metabolic health.
——————————————————————————–
8. Summary Table of Units and SDK Ranges
Parameter Name | Abbreviation | Unit of Measurement | SDK Estimated Range |
Blood Oxygen | SpO2 | % | 80 – 100 |
Heart Rate | HR | bpm | 40 – 200 |
Respiration Rate | Resp | brpm | 6 – 36 |
Systolic BP | BPS | mmHg | 75 – 140 |
Diastolic BP | BPD | mmHg | 70 – 100 |
Blood Glucose | BG | mg/dL | 75 – 150 |
Heart Rate Variability | HRV | ms | ~25 – 105 (Age dependent) |
Reflection Index | RI | % or 0–1 | 0.6 – 0.9 (60% – 90%) |
Arterial Stiffness Index | LASI/SI | m/s | 4 – 12 |
Stress | Stress | 1–100 | 1 – 100 |
——————————————————————————–
 MEDICAL DISCLAIMER: This handbook is for educational purposes only. The information provided is based on software-based estimations and is intended to complement, not replace, the medical care chain. Only a qualified doctor can diagnose underlying causes or diseases. If you have health complaints, always seek professional medical care.